What Is the Gap Between Theoretical and Actual Food Cost?
Theoretical food cost is what your recipes say you should spend per plate. Actual food cost is what your kitchen really spends after waste, theft, over-portioning, and spoilage. The gap between these two numbers typically runs 3 to 7 percentage points in restaurants I have consulted for across Pune, Ahmedabad, and Surat. That gap is pure profit walking out the back door every single day.
Most operators never calculate theoretical food cost at all. They look at one number on the P&L. They compare purchases to revenue and call it food cost. That single number hides everything. It hides the cook who eyeballs cheese by the handful. It hides the 4 kg of dough that dries out every night because nobody wraps it. It hides the vendor invoice that does not match the delivery weight.
This case study is about a pizza brand in Pune that was “profitable” for eleven months. Until it was not.
What Did the Numbers Look Like on the Surface?
The brand operated two cloud kitchen locations in Pune, both listed on Swiggy and Zomato. Monthly revenue across both kitchens was roughly Rs 14 lakh. The owner tracked food cost as total purchases divided by total revenue. That number showed 33%. For a pizza brand, 33% felt acceptable.
Rent across both locations was Rs 1.8 lakh. Staff cost was Rs 2.9 lakh. Aggregator commissions averaged around 22% after GST, which came to roughly Rs 3.08 lakh per month. Packaging ran another Rs 65,000. On paper, the brand cleared Rs 90,000 to Rs 1.1 lakh in monthly profit. Not great, but positive.
The problem surfaced when the owner wanted to open a third kitchen. He needed a loan. The bank asked for audited financials. When the CA sat down with real numbers, the picture fell apart.
How Did Theoretical vs Actual Food Cost Reveal the Real Problem?
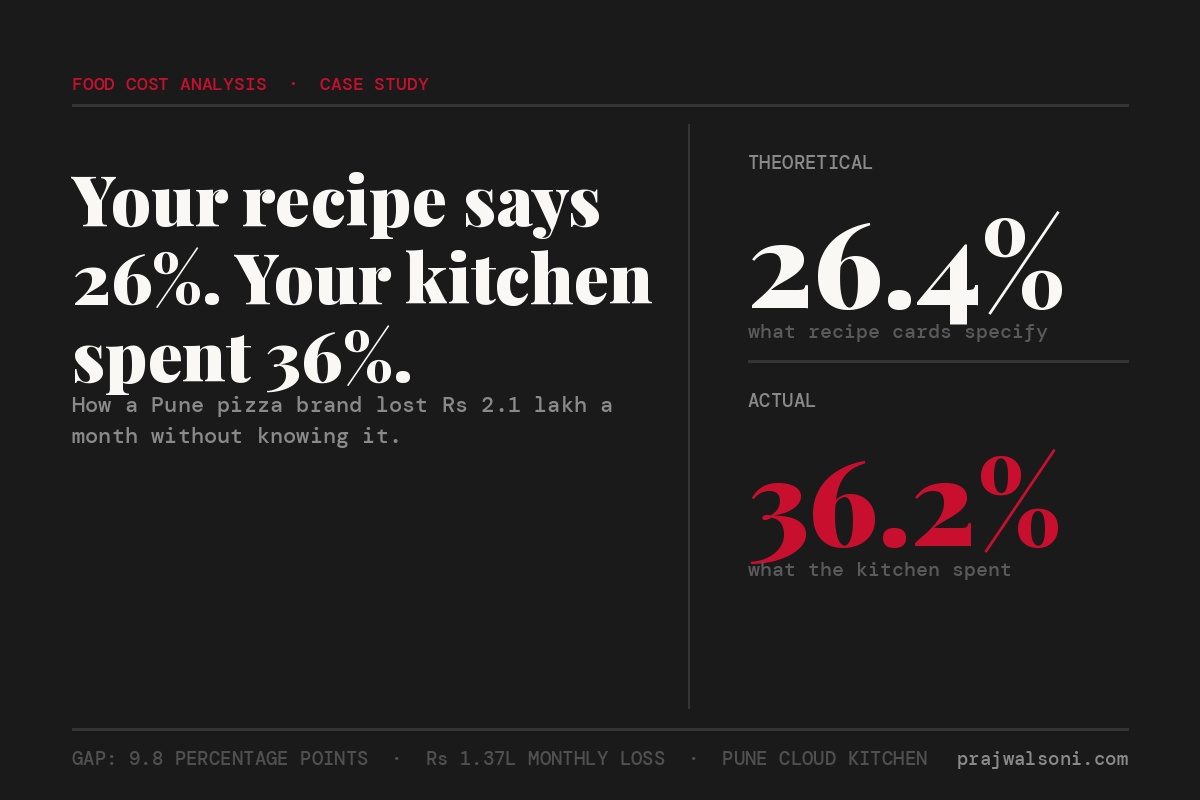
The first thing we did was build a recipe cost card for every item on the menu. This brand had 28 SKUs. Each recipe was costed at current supplier rates, with exact gram weights for every ingredient. The theoretical food cost came out to 26.4% of revenue. But actual food cost from purchases and inventory was 33%. That is a 6.6 percentage point gap.
On Rs 14 lakh monthly revenue, 6.6 percentage points equals Rs 92,400 per month of unexplained loss. Over a year, that is Rs 11 lakh gone. But it got worse.
When we dug into the actual food cost calculation, we found the owner had not been counting closing inventory properly. He was using a rough estimate each month instead of a physical count. Once we did a proper opening and closing inventory for one full month, actual food cost jumped from 33% to 36.2%. The real gap was not 6.6 points. It was 9.8 points.
At 9.8 points on Rs 14 lakh revenue, the monthly bleed was Rs 1.37 lakh. Add the Rs 73,000 in vendor pricing discrepancies we found (more on that below), and total monthly loss from food cost mismanagement was Rs 2.1 lakh. The brand was not profitable. It was losing money every month and calling it profit because nobody tracked the right margins.
Where Exactly Was the Money Leaking?
The Rs 2.1 lakh monthly loss came from four specific sources. Each one is common in restaurants across India, not unique to this brand. Here is the breakdown.
1. Over-portioning on Cheese and Sauces
Mozzarella is the single most expensive ingredient in a pizza kitchen. The recipe card specified 120 grams per 10-inch pizza. Kitchen staff were putting 160 to 180 grams because “customers complain about less cheese.” Nobody had ever weighed portions after training day. That 40 to 60 gram difference on roughly 900 pizzas per month across both kitchens added up to Rs 38,000 in excess cheese cost alone.
Sauces had the same problem. Pizza sauce was ladled, not measured. The variance was roughly 30% above recipe spec. For a high-volume item, even a Rs 3 overuse per unit compounds fast.
2. Vendor Invoice Manipulation
One supplier was invoicing mozzarella at Rs 340 per kg. The agreed rate was Rs 310 per kg. Nobody cross-checked invoices against the rate card because the kitchen manager handled receiving and the owner only saw monthly totals. Over two months, this overcharge added up to Rs 28,000.
Another supplier was delivering 22 kg bags of flour marked as 25 kg. We weighed three consecutive deliveries. All three were short. That is a quiet 12% theft on your single largest volume ingredient. Cash flow problems often start here, at the receiving dock, not at the bank.
3. Prep Waste That Nobody Measured
Dough was prepped in bulk every morning. Leftover dough at night was thrown away because it dried out. There was no system for staggering prep across the day based on order volume patterns. Roughly 8 to 10 kg of dough was wasted daily across both kitchens. At Rs 30 per kg ingredient cost, that is Rs 9,000 per month. Small by itself. But waste compounds across every ingredient category.
Vegetable prep waste was not tracked at all. Bell peppers, onions, and mushrooms were prepped without yield calculations. The kitchen assumed 100% yield on vegetables, which is never true. Real yield on bell peppers after trimming is closer to 82 to 85%.
4. No Recipe Costing Updates After Price Changes
Mozzarella prices had increased 18% over six months. The menu prices had not changed at all. Menu pricing must be re-evaluated every time a key ingredient cost shifts by more than 5%. This brand had not updated pricing in eleven months. The theoretical food cost of 26.4% was already higher than the 24% it had been when the menu launched. But nobody was tracking that drift.
What Specific Interventions Fixed This?
We implemented five changes over three weeks. None required capital investment. All required discipline and a POS system that could track recipe-level costs. The brand was already using Petpooja, so we built the recipe module inside it.
First, we loaded every recipe into Petpooja with exact gram weights. Every ingredient. Every variant. Every size. This gave us a live theoretical food cost per order that auto-calculated against daily sales.
Second, we installed a Rs 1,200 digital scale at each pizza station. Cheese and sauce portions were weighed for every order for the first two weeks. After that, cooks developed muscle memory. We spot-checked twice a week going forward.
Third, we moved to daily inventory counts on the top five ingredients by cost: mozzarella, flour, olive oil, pizza sauce, and chicken. This took 12 minutes per day. It immediately surfaced variances before they accumulated into monthly surprises. Cloud kitchen profitability depends on this kind of daily vigilance.
Fourth, we renegotiated supplier rates with three competing quotes for each key ingredient. Mozzarella moved from Rs 340 (the inflated invoice rate) to Rs 295 per kg with a new supplier. Flour was switched to a supplier who delivered sealed 25 kg bags with printed weights.
Fifth, we adjusted menu prices on six items where the food cost exceeded 35%. Two pizzas went up by Rs 20. One went up by Rs 30. The impact on order volume was negligible because pricing was still competitive for the Pune market on Swiggy.
What Were the Results After 60 Days?
Actual food cost dropped from 36.2% to 28.8% within 60 days. The gap between theoretical and actual food cost narrowed from 9.8 points to 2.4 points. That 2.4 point residual gap represents normal operational variance that every kitchen carries. Zero gap is not realistic. But anything above 3 points means money is leaking.
In rupee terms, the monthly food cost saving was Rs 1.73 lakh on the same Rs 14 lakh revenue. The brand went from a real monthly loss of roughly Rs 1 lakh to a genuine profit of Rs 70,000 to Rs 80,000 per month. That is the difference between a business that slowly dies and one that can actually fund its own growth.
The owner did not open a third kitchen. He fixed the two he had first. That decision alone probably saved him Rs 8 to 10 lakh in setup costs for a kitchen that would have carried the same invisible losses.
Why Does This Happen to So Many Operators?
Because most restaurant operators track food cost as one number. Purchases minus closing stock, divided by revenue. That formula gives you actual food cost. It tells you what you spent. It does not tell you what you should have spent. Without theoretical food cost as your benchmark, you have no way to know whether 33% is good or catastrophic for your specific menu.
A biryani brand at 33% food cost might be doing fine because rice and spices are cheap relative to selling price. A pizza brand at 33% is bleeding because cheese and processed meats are expensive. The percentage alone means nothing without the recipe-level benchmark underneath it. According to the NRAI India Food Services Report 2024, the organized restaurant segment is growing at 13.2% CAGR. But growth means nothing if your unit economics are broken at the recipe level.
GST compliance gets all the attention because penalties are visible. Food cost variance is invisible until the bank account runs dry. That is why it is more dangerous.
The Principle Behind the Case
Every restaurant needs two food cost numbers, not one. Theoretical food cost comes from your recipe cards, updated monthly with current supplier rates. Actual food cost comes from physical inventory counts and purchase records. The gap between them is your variance report. That report tells you exactly where to look: portioning, waste, theft, or pricing drift.
In restaurants I have worked with, closing this gap by even 3 to 4 percentage points typically adds Rs 50,000 to Rs 1.5 lakh to monthly profit depending on revenue scale. No new customers required. No marketing spend. No menu redesign. Just measuring what you are already doing and fixing the deviations.
If you run a restaurant doing Rs 8 lakh or more in monthly revenue, you can start this week. Pull your top 10 selling items from your POS. Build a recipe cost card for each one using today’s supplier prices. Add up the theoretical food cost for last month’s sales mix. Compare it to what you actually spent. If the gap is more than 3 points, you have found money that belongs in your pocket.
Stop guessing. Start building. Get Design Dine Dominate, the complete restaurant business playbook from someone who has actually done it.

Leave a comment