Cloud kitchen profitability in India separates operators who build systems from operators who chase orders. Most cloud kitchens in India bleed money. Not because delivery is broken. Because operators run delivery kitchens with dine-in accounting. You are reading this because your margins feel thin despite high order volume. This article gives you the exact metrics framework that separates profitable cloud kitchen operators from those losing money every month in 2026.
Why Cloud Kitchens Fail Despite High Order Volume
Cloud kitchen profitability is math. Nothing more.
Yet most Indian cloud kitchen operators cannot tell you their cost per delivery by brand. They cannot tell you their average order value by virtual brand. They track total revenue and hope the rest works out.
I have seen this pattern across every cloud kitchen I have consulted with. The operator shows me monthly revenue of 8 lakhs and calls it a good month. Then I ask for brand-wise contribution margin. Blank stare.
The problem started when cloud kitchens looked attractive. Low rent in non-prime locations. No front-of-house labor. Pure delivery volume. But aggregator commissions sit at 18-30% depending on your city, cuisine, volume tier, and negotiation. These are not fixed numbers. They depend on your agreement.
Simultaneously, food costs stayed sticky because operators never built portion control into delivery menus. Rent rose in secondary locations as competition intensified. By 2025, most operators were working 12-15 hour days producing negative unit economics.
This is not a demand problem. India’s online food delivery market crossed USD 55 billion in 2025 according to IMARC Group research. That is roughly 4.5 lakh crores. The market is massive and growing at over 20% annually. Demand exists. Your unit economics do not.
You are running multiple virtual brands from one kitchen. But you are tracking them like a single entity. That is where the money disappears.
Five Mistakes That Kill Your Cloud Kitchen Margins
Most cloud kitchen operators make these five mistakes simultaneously.
First, they do not segment profitability by virtual brand or dish category. Your paneer tikka from Brand A might have strong contribution margin while your biryani from Brand B loses money after commission. Without this visibility, you keep promoting the wrong products.
Second, they hide aggregator commission impact by bundling it into overall costs instead of tracking it as a line item against each brand’s revenue. Swiggy and Zomato deduct commission differently. Zomato calculates commission on subtotal plus packaging, excluding customer GST. Swiggy calculates it on subtotal plus packaging plus GST. This difference changes your actual payout per order. Track it separately.
Third, they do not measure delivery radius performance. Orders from closer zones have higher delivery success rates and better repeat purchase behavior. Yet most operators accept every order the platform sends without analyzing which zones generate profit and which destroy it.
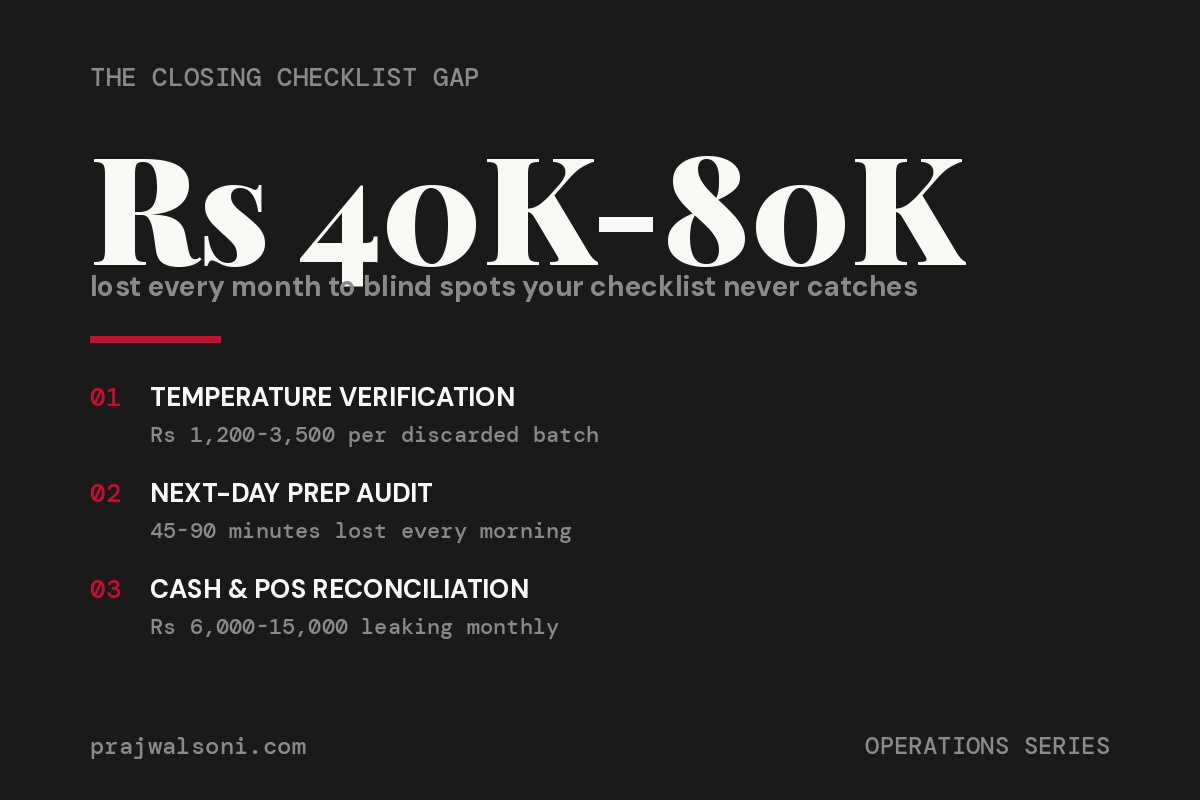
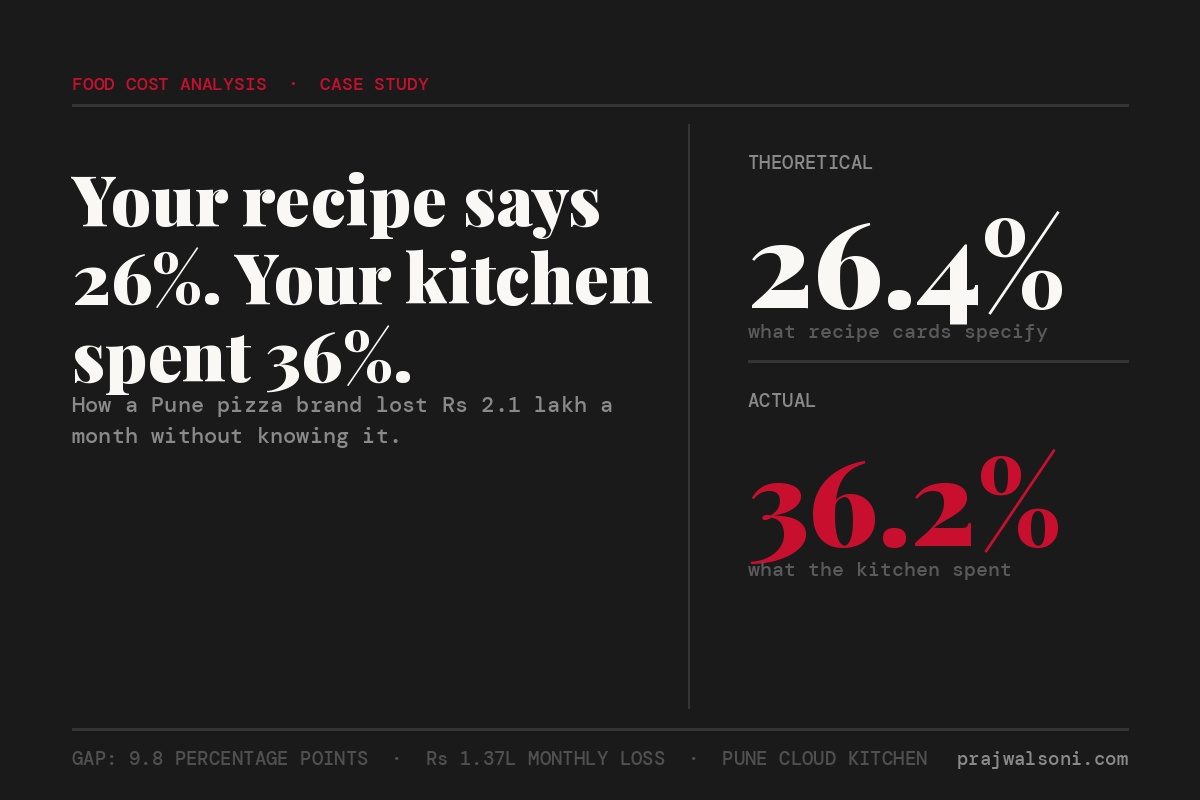
Fourth, they inflate food costs by not tracking portion drift. A chef serving dine-in sees immediately if portions are wrong. In delivery, drift compounds invisibly over weeks. I have walked into cloud kitchens where actual food cost was 7% higher than theoretical food cost. Nobody noticed because nobody measured.
Fifth, they do not measure customer acquisition cost by brand or channel. Without this number, you cannot calculate lifetime value. Without lifetime value, you cannot decide where to invest.
What Profitable Cloud Kitchen Operators Track Every Week
Profitability in cloud kitchens requires discipline, not talent. These are the five metrics profitable operators measure every week. I have tested this framework across operators running 4-15 kitchens in tier-1 and tier-2 Indian cities.
Contribution Margin Per Brand Per Dish Category. Track revenue minus food cost minus aggregator commission minus packaging minus direct labor. Do this by virtual brand and by dish category separately.
Here is a realistic example. Your butter chicken lists at 249 rupees on Zomato. After 25% commission (roughly 62 rupees), food cost of 65 rupees, packaging of 10 rupees, and direct labor allocation of 15 rupees, your contribution per order is roughly 97 rupees. That is 39% contribution margin. Solid.
Now your fried rice from a different brand lists at 179 rupees. After 25% commission (roughly 45 rupees), food cost of 55 rupees, packaging of 8 rupees, and direct labor of 12 rupees, contribution is 59 rupees. That is 33%. Still positive but lower.
This number tells you which dishes to push and which to fix or kill. Most operators run blind to this.
Customer Acquisition Cost and Lifetime Value by Brand. Track how much you spend on visibility and promotion per new customer. Then track how many times that customer reorders, at what average value, and at what margin.
If your acquisition cost is 320 rupees and lifetime value is 480 rupees, your multiple is 1.5x. That is barely sustainable. Profitable operators target 2.5x to 3.5x. If your multiple is below 2x, either reduce acquisition cost or increase repeat rate.
Order Fulfillment Time and Delivery Radius Performance. Track average preparation time and delivery completion rate by distance zone. Create three buckets: 0-3km, 3-5km, and beyond 5km. Orders within 3km typically show better completion rates and significantly higher repeat purchase rates than distant orders.
This tells you whether to accept orders from farther zones at all. If orders beyond 5km show cancellation rates above 15% and repeat rates below 10%, you are losing money on them even if individual order margins look positive.
Portion Drift and Waste Tracking. Once a week, randomly weigh and cost 5-8 orders per brand during service. Compare actual food cost against your theoretical recipe cost. Most operators I work with discover 4-6% food cost inflation within the first three months of opening. This exercise takes 30 minutes per week and can save lakhs annually.
Net Kitchen Profitability After Fixed Costs. Take total contribution margin from all brands in one kitchen. Subtract fixed costs: rent, utilities, base staff salary, insurance, and FSSAI compliance. Divide by total revenue. This is your true kitchen profitability number.
Most operators running cloud kitchens in tier-1 cities have 1.5 to 2.2 lakh monthly fixed cost per kitchen. If your total brand revenue from one kitchen is 8 lakhs and total contribution is 1.6 lakhs, after 1.8 lakh fixed cost, you are negative. That kitchen needs to reach 12 lakh revenue or higher to hit 8-10% net margin.
Build these five metrics into a weekly dashboard. Review it every Monday with your kitchen lead and delivery manager. The conversation is simple. Which brand improved? Which slipped? What changed? This discipline separates 4% margin operators from 12% operators.
Cloud Kitchen Profitability in Tier-2 Cities
Tier-1 cities like Delhi, Mumbai, Bangalore, and Hyderabad force you to compete on brand strength and delivery speed. Tier-2 cities like Pune, Jaipur, Ahmedabad, Lucknow, and Coimbatore have different economics entirely.
Here is where most operators get the market dynamics wrong. Nationally, Zomato holds roughly 55-58% of India’s food delivery market share. Swiggy holds 42-45%. In tier-2 and tier-3 cities specifically, Zomato has been expanding aggressively through its restaurant discovery network and Blinkit infrastructure. Swiggy has strong logistics speed in metros but Zomato’s reach in smaller cities has grown faster since 2024.
This matters because your negotiation leverage and platform strategy depend on which aggregator dominates your city. Do not assume Swiggy dominates tier-2. Check your local data.
Tier-2 operators face roughly 25-30% lower average order values than tier-1. This means tier-2 profitability requires stricter cost control. Your fixed cost per kitchen should stay below 1.4 lakh monthly. Your food cost percentage must hit 26-28% versus tier-1’s typical 28-32%.
Most importantly, you cannot sustain more than two virtual brands per kitchen in tier-2 without destroying operational consistency. Tier-1 operators sometimes run 3-4 brands per kitchen. Tier-2 chaos multiplies faster because order volume per brand is lower and kitchen staff is typically less experienced.
Commission negotiation matters enormously in tier-2. Both Swiggy and Zomato offer negotiated rates based on volume, exclusivity, and launch incentives. The exact rate depends entirely on your city, cuisine type, and account manager. Push for the best terms you can get during onboarding. Every 2% reduction in commission on 6 lakh monthly revenue is 12,000 rupees additional monthly profit. Over a year, that is 1.44 lakhs.
One more thing tier-2 operators overlook. Cancellation rates and refund chargebacks in tier-2 tend to run higher than tier-1. Account for 1-3% of revenue lost to cancellations, partial refunds, and platform-initiated adjustments. Build this into your margin model instead of discovering it at month end.
Common Mistakes Cloud Kitchen Operators Make in 2026
Chasing order volume without unit economics discipline. You accept all orders the platform sends, including from zones with long delivery times, high cancellation rates, and low repeat purchase rates. You appear busy while losing money systematically. Set a minimum acceptance radius based on your fulfillment capacity and margin targets. Then stick to it.
Running virtual brands without tracking profitability separately. Your biryani brand and your sandwich brand share a kitchen but have completely different food costs, labor intensity, and repeat customer profiles. If you do not track them separately, you subsidize loss-making brands with profit from winners. Kill or fix the underperformers within 90 days.
Ignoring the actual payout calculation. Commission is not the only deduction. Payment processing fees (typically 1.9-2% for UPI gateway), GST on platform fees (18%), and TDS (0.1% under Section 194O) all reduce your actual payout. On a 300 rupee order at 25% commission, your actual take-home is significantly less than the 225 rupees you expect. Calculate your real payout using your Swiggy/Zomato settlement reports, not theoretical commission percentages.
Treating packaging as a fixed cost. Most operators spend 8-12 rupees per order on packaging. If you are doing 200 orders per day, that is 48,000 to 72,000 rupees monthly. Test different container sizes by brand. A smaller, well-fitted container for a dry item costs less than an oversized container with leakage risk. Small packaging optimizations compound across thousands of orders.
Ignoring FSSAI compliance as a profit driver. A single hygiene violation can drop your aggregator rating below 3.5 stars. That rating drop can cut order volume 30-40% within two weeks. FSSAI compliance costs 15,000 to 25,000 rupees annually per kitchen. One month of lost orders from a rating drop costs 2 to 3 lakhs. Compliance is not a cost. It is insurance.
What You Should Do This Week
Do not wait for next quarter. Cloud kitchen profitability is a weekly discipline.
This week, pull your Swiggy and Zomato settlement data for the last 90 days. Not the dashboard revenue number. The actual settlement reports that show commission deducted, GST charged, TDS withheld, and net payout credited.
Calculate your real payout percentage. Most operators discover their actual take-home is 5-8% lower than they assumed.
Then pick your highest-volume virtual brand. Calculate contribution margin for its top 5 selling dishes using the formula above. Revenue minus food cost minus actual commission minus packaging minus direct labor.
You will find at least one dish that is losing money. Kill it or reprice it this week.
If you want a complete framework for building a profitable restaurant from concept through expansion, my book Design Dine Dominate covers exactly this. It is the restaurant business playbook from someone who has actually done it. Not theory. Not textbook. Real operations.
Start with the numbers. The numbers do not lie.

Leave a comment