Picture this: you are running a restaurant in Pune when your Swiggy dashboard shows your best month ever. Orders are up. Your Petpooja report says Rs 14 lakh in sales. Then rent, salaries, and vendor bills clear, and the account holds less than last month. Most operators judge success by sales and the bank balance. Those are the loudest restaurant health metrics, and the least honest.
Sales measure how busy you are. Health is a different question. A restaurant can grow revenue for six months while quietly losing customers, margin, and cash. Growth across the industry also hides the damage. The NRAI India Food Services Report 2024 values the sector at Rs 5.69 lakh crore. NRAI projects it will reach Rs 7.76 lakh crore by 2028. In a rising market, weak outlets look fine until the month they suddenly do not.
Across 23 cloud kitchen brands and 18 restaurants, I found the real diagnosis underneath the sales report. It sits in four layers: revenue quality, net realisation, owner-adjusted profit, and cash runway. Each layer catches a lie the others miss. Read together, they tell you whether you are winning or just busy.
What Are the Restaurant Health Metrics That Actually Matter?
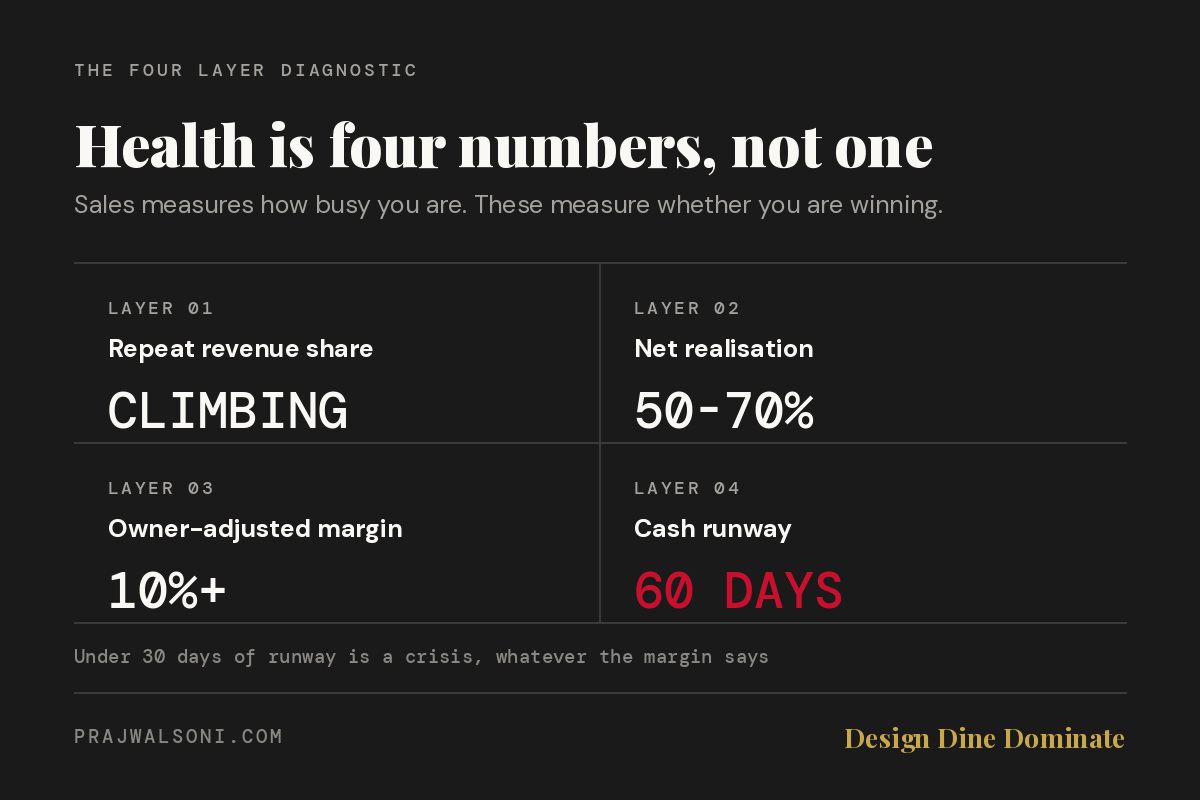
Four numbers show whether a restaurant is actually succeeding. They are repeat revenue share, net realisation per order, owner-adjusted margin, and cash runway. Sales describe activity, while these four describe durability. A healthy outlet shows repeat share climbing and adjusted net margin above 10%. It also holds enough cash for at least 60 days of fixed costs.
The margin benchmarks are well established. Net margins of 5-8% signal a struggling outlet, 10-15% is healthy, and 15-25% is top-performing. You can see how operators land in each band in this breakdown of restaurant profit margins at 5% versus 15%. The problem is that most owners calculate margin in a way that puts them in the wrong band. Each layer below corrects one part of that error.
Layer 1: Is Your Revenue Earned or Rented?
Revenue is earned when customers come back at full price. It is rented when it vanishes the week you switch off the offer. Track two numbers every month: repeat revenue share and discount dependency. Rented revenue inflates sales while margin leaks out underneath, so the dashboard looks strongest right before the business weakens.
Repeat revenue share means the percentage of sales from customers who have ordered before. Swiggy and Zomato partner dashboards show new versus repeat customers. For dine-in, capture phone numbers at billing in Petpooja or Posist and you get the same split. Discount dependency means the share of orders that used a discount you funded.
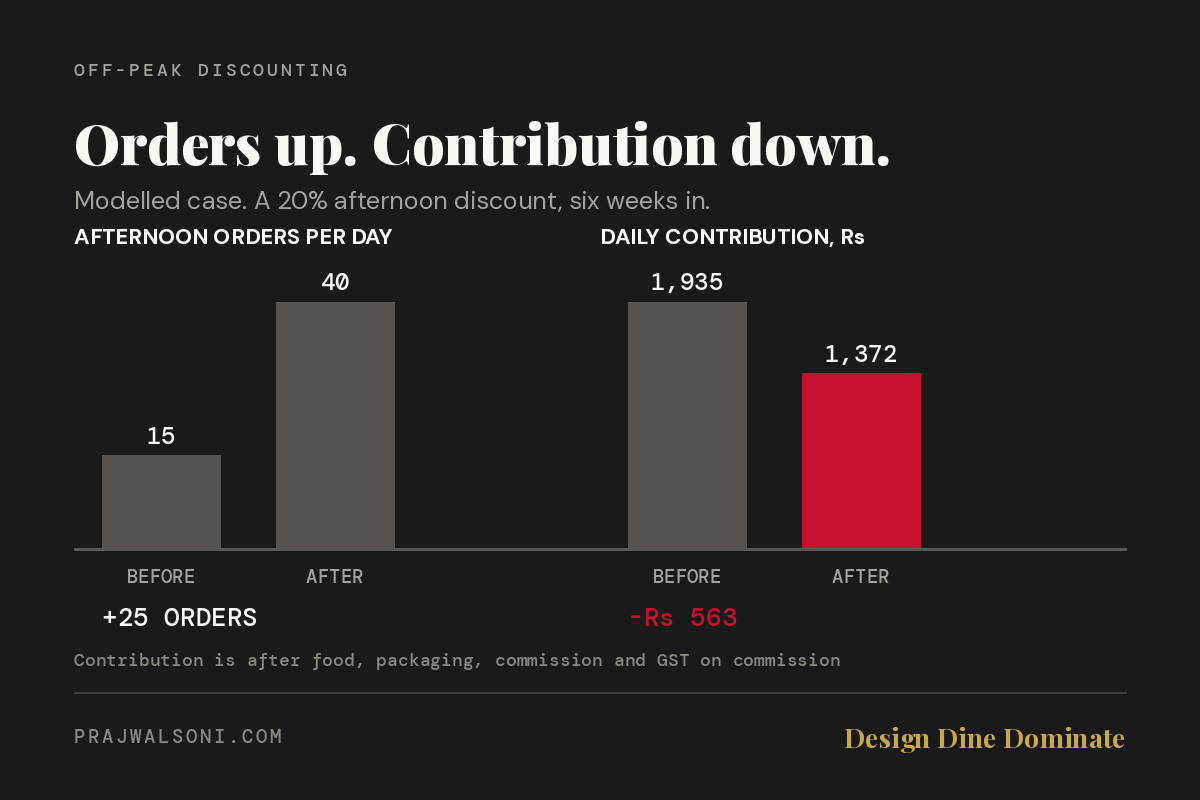
Discount dependency is the sharper test. Picture a Hyderabad biryani brand running 40% off up to Rs 80 on Zomato. Orders look strong for weeks. Then the brand pauses the offer and volume drops by half. That half was never loyal to the biryani. Those customers were loyal to the Rs 80.
In the cloud kitchens I ran, the brands that lasted rarely had the biggest launch spikes. They were the ones whose repeat share kept climbing after month three. If your repeat share is flat, another discount will not fix it. A loyalty program built for how Gen Z actually orders does more work for less money. Still, it only helps once the product earns that second order.
Layer 2: How Much of Your Menu Price Actually Reaches the Bank?
On a delivery order, only 50-70% of the menu price typically reaches your bank before food cost. Commission, 18% GST on that commission, restaurant-funded discounts, and packaging all come off first. Net realisation means the share of menu price you keep after these channel costs. Track it for each channel, because a blended number buries the problem.
A Rs 400 Biryani, Taken Apart
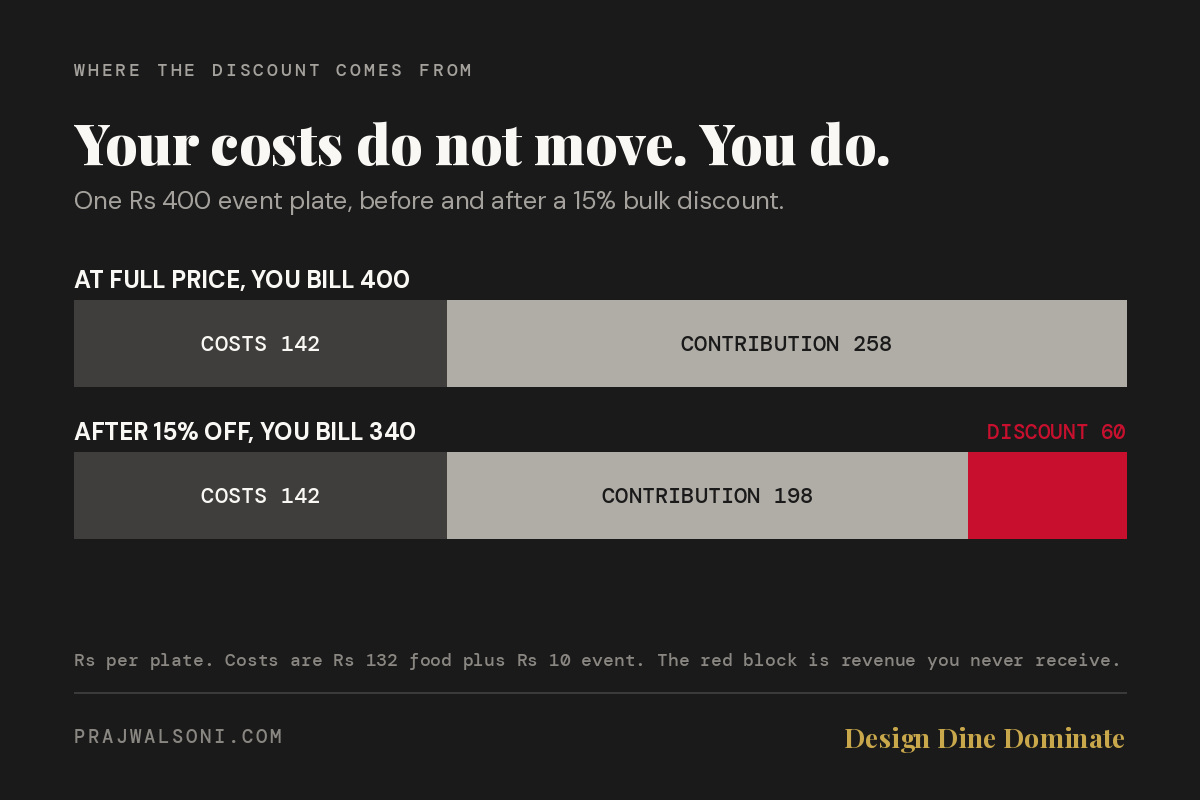
Take a Rs 400 order on Swiggy with a Rs 60 discount you fund. The customer pays against Rs 340. At a 25% commission, the platform keeps Rs 85. GST at 18% on that commission adds roughly Rs 15. Packaging costs another Rs 25. You keep about Rs 215, or 54% of the menu price.
Commissions range from 15% to 30% depending on city, volume, and plan, so run your own contract numbers. Food cost then comes out of Rs 215, not Rs 400. A 32% food cost on the menu price is Rs 128. Against what you actually received, that is nearly 60%. Dine-in looks very different, because realisation usually sits above 95% after card charges.
This is why channel mix changes health even when sales stay flat. If delivery grows from 30% to 50% of revenue, blended realisation falls and every cost ratio worsens. Before blaming the kitchen, check whether your aggregator commission rates are worth renegotiating. Then compare your delivery numbers against these cloud kitchen profitability metrics for 2026.
Layer 3: Would Your Profit Survive Paying Yourself?
Most owner-run restaurants overstate profit because the owner works full-time unpaid, or the family owns the building. Owner-adjusted profit means net profit after charging a market-rate manager salary and market rent. If adjusted margin falls below 10%, the restaurant is not yet a healthy business. It is a job that happens to pay you.
Run it on a hypothetical Surat outlet doing Rs 10 lakh a month with Rs 1.2 lakh left over. That reads as 12%, comfortably healthy. But the owner runs the floor 12 hours a day. Replacing him with a hired manager in Surat might cost Rs 40,000 to Rs 60,000 a month. Charge Rs 50,000 and the margin drops to 7%.
Now add rent. Say the space is family-owned, so the P&L shows zero. Rent in most cities runs 8-15% of revenue. Even at 8%, that is Rs 80,000 a month, and the outlet slides to a Rs 10,000 loss.
This layer matters most when you plan a second outlet. The new location needs a paid manager and market rent from day one. If the first outlet only works because you are free, the second will struggle from the start. I have seen this pattern stall more expansion plans than bad locations ever did. Read why operators fail when they scale without discipline before signing that second lease.
Layer 4: How Many Days Can You Survive a Bad Month?
You can survive exactly as many days as your cash covers fixed costs with zero sales. Below 30 days, one bad month turns into a crisis. Aim for at least 60 days before any expansion or renovation. Cash runway means that number of days, calculated as cash in the bank divided by daily fixed outflow.
Fixed outflow includes rent, salaries, EMIs, and minimum utility charges. Say that adds up to Rs 4.5 lakh a month. That works out to Rs 15,000 a day. With Rs 2.25 lakh in the account, you have 15 days of runway. One slow monsoon fortnight and you are borrowing to pay salaries.
Profit does not show this number. A restaurant can report a 12% margin and still carry two weeks of runway. Aggregator payouts arrive on a weekly cycle, while vendors want payment on their own schedule. GST payments also fall due on fixed dates, which you can confirm on the CBIC GST information portal. For the mechanics, read how profitable restaurants still go bankrupt on cash flow.
Watch the direction more than the level. Runway that shrinks three months running is a warning, even while sales climb.
How Do Restaurant Health Metrics Interact With Each Other?
The four layers only make sense together, because one strong layer can hide a weak one. Rising sales with falling repeat share means you are buying growth. Healthy margin with shrinking runway means cash is leaking somewhere the P&L misses. Reading the combination tells you exactly which problem to fix first.
In the outlets I review, four combinations show up again and again. Each one points to a different fix.
- Sales up, repeat share down, discount share up. You are renting growth. Fix the product and portion before spending another rupee on offers.
- Reported margin healthy, adjusted margin thin. You own a job. Build a manager layer before you build a second outlet.
- Margin fine, runway shrinking. Cash is stuck in inventory, deposits, or delayed payouts. Fix working capital before chasing sales.
- Delivery share rising, net realisation falling. Channel mix is eating your margin. Reprice the delivery menu and push direct orders.
Most first-year failures I have seen carried two of these patterns at once, and the owner watched only sales. That is a big part of why 70% of restaurants fail in the first year. None of these patterns appears in a daily sales report.
The Scorecard in Five Lines
Five facts from this breakdown belong on one sheet beside your monthly P&L. Together they replace the sales report as your main test of success. Review them on the same date every month, and act on three-month trends instead of one bad week.
- Repeat revenue share should climb month on month. Flat repeat share with rising sales means discounts are carrying you.
- Delivery net realisation typically lands between 50% and 70% of menu price once commission, GST on commission, discounts, and packaging come off.
- Owner-adjusted margin below 10% means the outlet still depends on your unpaid time or free property.
- Cash runway under 30 days is a crisis. Target 60 days before any expansion.
- Healthy net margin sits at 10-15%, and top performers reach 15-25%. Only adjusted numbers count.
Build Your Restaurant Health Metrics Scorecard This Week
You can build this scorecard in one afternoon with reports you already have. Pull data from Swiggy, Zomato, your POS, and your bank statement. Then calculate each layer once and write the four numbers on a single sheet. After that, repeat the exercise on a fixed date every month.
- Open your Swiggy and Zomato partner dashboards. Note repeat customer share and discounted order share for the last three months.
- Pick 20 delivery orders from last week’s settlement statement. Calculate net realisation for each one.
- Rewrite last month’s P&L with a market manager salary and market rent, even if you pay neither.
- Divide the cash in your bank by your daily fixed outflow to get runway in days.
- Put all four numbers on one sheet. Repeat the exercise on the 5th of every month.
If net realisation turns out to be the weakest layer, start with the psychology and math behind menu pricing. Delivery menus priced like dine-in menus are usually where the leak begins.
Stop guessing. Start building. Get Design Dine Dominate, the complete restaurant business playbook from someone who has actually done it.

Leave a comment