The Real Benchmark for Restaurant Labour Cost
Restaurant labour cost typically runs 18-28% of revenue depending on format, city, and service style. A cloud kitchen in Surat should sit closer to 18%. A full-service dine-in restaurant in Bengaluru with a bar will push 26-28%. If your labour cost percentage does not change between your slowest Tuesday and your busiest Saturday, you are not scheduling. You are just filling shifts.
I have seen this across dozens of restaurant operations. The owner looks at monthly payroll, divides by monthly revenue, gets a number like 22%, and moves on. That single number hides the real problem. Because labour cost is not a monthly number. It is a daily number. An hourly number, if you want to get precise about it.
And most operators in the Indian restaurant industry do not track it hourly. They do not even track it daily. They discover they overspent on labour only when the P&L arrives weeks later. By then, the money is already gone.
What Does the Before Look Like for Most Operators?
Here is a situation I see constantly. A restaurant in Ahmedabad doing Rs 12 lakh per month in revenue. The owner employs 14 full-time kitchen and service staff. Monthly payroll including PF, ESI, and overtime comes to Rs 2.88 lakh. That is exactly 24% of revenue. Looks fine on paper.
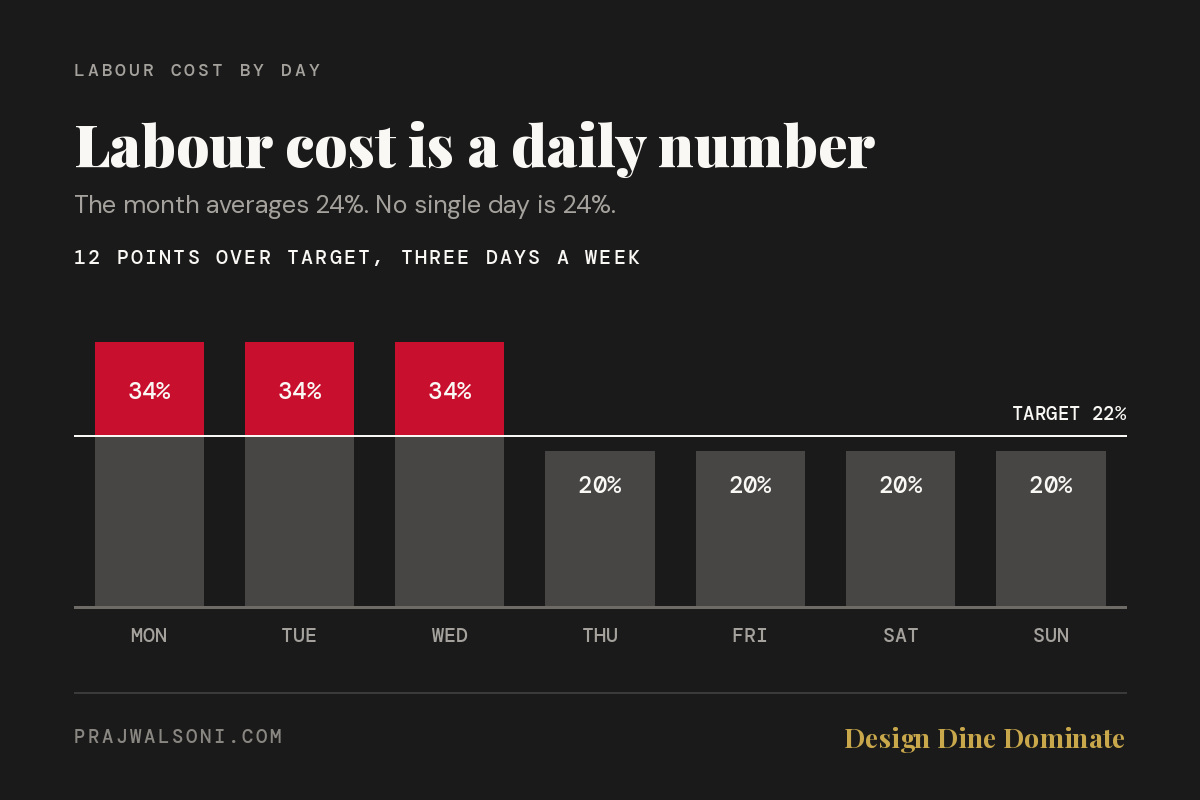
But look closer at how those hours are distributed. Monday through Wednesday, the restaurant does roughly Rs 28,000 per day. Thursday through Sunday, it pushes Rs 48,000 per day. Same 14 people show up every single day. Same shifts. Same hours.
On Monday, the restaurant pays Rs 9,600 in labour cost against Rs 28,000 in revenue. That is 34%. On Saturday, the same Rs 9,600 runs against Rs 48,000. That is 20%. The monthly average of 24% is a fiction. It blends a profitable weekend with a bleeding weekday and makes both invisible.
This is how restaurants that look profitable on paper end up at 5% net margins instead of 15%. The labour line does not flex with demand. So every slow day quietly eats into margins earned on busy days.
The hidden costs inside your payroll number
Most operators undercount labour cost because they only count base salaries. The real number includes employer PF contribution at 12%, ESI at 3.25% for eligible employees, overtime pay, staff meals, uniforms, and accommodation if provided. For a restaurant in Pune paying Rs 15,000 base salary to a cook, the true cost is closer to Rs 18,500 once you add statutory contributions and staff meals at Rs 80-100 per day.
If you are not calculating your fully loaded labour cost, your benchmark percentage is wrong from the start. Your GST compliance already requires accurate payroll records. Use those same numbers to calculate what each hour of labour actually costs you.
What Does Properly Scheduled Labour Cost Actually Look Like?
A well-scheduled restaurant keeps daily labour cost within 2-3 percentage points of its target across every day of the week. If your target is 22%, Monday should be 23-24% and Saturday should be 20-21%. Not 34% on Monday and 20% on Saturday.
This means your staffing levels change based on expected revenue. Fewer people on slow days. More people on peak days. Split shifts during gaps between lunch and dinner. Part-time staff covering only the rush window.
In restaurants I have consulted for, fixing scheduling alone, without changing anyone’s salary, without firing anyone, just by redistributing hours, typically brings labour cost down by 2-4 percentage points of revenue. On Rs 12 lakh monthly revenue, that is Rs 24,000 to Rs 48,000 saved every month. Rs 2.9 lakh to Rs 5.7 lakh saved per year. No investment required. Just better math.
The after looks like an operation where the owner knows exactly how many labour hours are needed per Rs 1 lakh of revenue. Where shift schedules are built on Wednesday for the following week based on reservation data, historical sales, and local events. Where the cash flow impact of every staffing decision is visible before the week starts, not after it ends.
How Do You Calculate Labour Cost Per Revenue Hour?
Labour cost per revenue hour is calculated by dividing total daily labour cost by the number of hours the restaurant generates meaningful revenue. This metric tells you what each productive hour of operation costs in staffing, which is far more useful than a flat monthly percentage.
Here is the formula:
1. Calculate your fully loaded daily labour cost. Include salaries divided by working days, PF, ESI, overtime, and staff meals.
2. Identify your revenue hours. These are the hours during which you actually generate orders. For most restaurants, this is 4-6 hours during lunch and dinner peaks, not the full 10-12 hours you are technically open.
3. Divide daily labour cost by revenue hours.
4. Compare this number against your average revenue per hour during those same windows.
If your labour cost per revenue hour is Rs 1,600 and your average revenue per hour during peaks is Rs 8,000, your peak-hour labour ratio is 20%. That is healthy. But if you are paying Rs 1,600 per hour in labour during a 3pm-6pm window where revenue drops to Rs 1,200 per hour, you are losing Rs 400 per hour in labour alone before rent, food cost, or any other expense.
This is exactly why cloud kitchens often outperform dine-in on margins. They schedule labour tightly around delivery peak windows and scale down fast when orders drop.
What Is the Bridge Between Overstaffed and Optimized?
The bridge is a single mechanism I call Revenue-Per-Labour-Hour scheduling, or RPLH. It works on one principle: you schedule backward from expected revenue, not forward from available staff.
Most operators schedule like this: “I have 14 people. Let me assign shifts.” RPLH scheduling works differently. It starts with: “Tomorrow is a Wednesday. Historical data says we will do Rs 32,000. At my target labour ratio of 22%, I can spend Rs 7,040 on labour. My fully loaded cost per staff member per shift is Rs 750. I can schedule 9 people tomorrow, not 14.”
Here are the three concrete steps to implement RPLH scheduling this week:
Step 1: Build your daily revenue forecast
Pull your last 8 weeks of daily sales from your POS. Petpooja, Posist, or whichever system you use. Sort by day of week. Calculate the average revenue for each day. Monday average, Tuesday average, and so on. Also note any outlier days caused by festivals, IPL matches, or weather events. Your forecast does not need to be perfect. It needs to be better than “same number of people every day.”
Step 2: Calculate your fully loaded cost per labour hour
Take each employee’s monthly CTC, including all statutory contributions. Divide by the number of days they work per month. Then divide by the hours per shift. A cook earning Rs 18,500 fully loaded who works 26 days a month on 10-hour shifts costs Rs 71 per hour. A part-time helper at Rs 10,000 fully loaded working 6-hour shifts costs Rs 64 per hour. Now you have a rupee cost for every hour of labour you deploy.
Step 3: Schedule to a daily labour budget
Multiply your forecasted daily revenue by your target labour cost percentage. That is your daily labour budget in rupees. Fill shifts starting with essential roles, your head cook, one prep assistant, one service staff member. Then add staff only if the remaining budget allows. If Wednesday’s budget is Rs 7,040 and essential roles cost Rs 4,800, you have Rs 2,240 left for additional coverage. That buys roughly 3 hours of an extra hand during the dinner rush. Not a full shift.
This approach requires you to have at least 2-3 part-time or flexible staff who can work variable hours. In cities like Surat, Nagpur, and Pune, finding part-time kitchen helpers at Rs 350-500 per shift is entirely possible. Many operators resist part-time hiring because it feels complicated. But the math is clear. Flexible staffing models also reduce turnover because you are not burning full-time staff on dead shifts where they stand around bored.
Why Does Scheduling by Gut Feel Cost You More Than You Think?
Gut-feel scheduling costs restaurant operators roughly 3-6% of revenue in misallocated labour, because human intuition overestimates the need for “safety” staffing on slow days and underestimates the revenue cost of understaffing on peak days.
When you overstaff a slow Tuesday, the obvious cost is wages paid for unproductive hours. The less obvious cost is that bored staff make mistakes. They overportion. They eat more staff meals. They clean less carefully because they know there is time to redo it later. Overstaffing does not just waste payroll. It creates a loose operational culture that bleeds into food cost, waste, and quality.
When you understaff a peak Saturday, the damage is different but equally expensive. Service slows down. Swiggy and Zomato orders take 8 minutes longer to prepare, and your ratings drop. Dine-in customers wait longer for tables to turn, which directly reduces covers per service. A restaurant doing 45-minute table turns instead of 35-minute turns on a Saturday night is leaving 2-3 extra covers on the table. At Rs 800 average ticket, that is Rs 1,600 to Rs 2,400 lost per service. Every Saturday.
Both problems come from the same root cause. No revenue-linked scheduling system. The operator is flying blind, making staffing decisions based on who is available instead of what the business needs.
Restaurant Labour Cost Benchmarks by Format
Labour cost benchmarks vary significantly by restaurant format, city, and whether you use aggregator delivery or your own riders. Here are the ranges I have seen work across the Indian market:
1. Cloud kitchens: 15-20% of revenue. You need fewer people. No service staff. Prep-heavy operations with 2-4 cooks and 1-2 packaging staff can handle Rs 3-5 lakh daily revenue.
2. QSR and fast casual: 18-22% of revenue. Counter service reduces headcount. Cross-training is essential so every person can handle multiple stations.
3. Casual dine-in: 22-26% of revenue. Service staff, bartenders, and a larger kitchen brigade push costs up. Table turns and covers per labour hour become your key metric.
4. Fine dining: 28-35% of revenue. Higher skill levels mean higher wages. This is offset by higher ticket sizes, but only if your pricing supports it.
If you are operating a casual dine-in restaurant and your labour cost is below 18%, you are almost certainly understaffed. Service quality is suffering even if you have not noticed yet. Your online reviews probably mention slow service or inattentive staff. Check your menu pricing to ensure it supports proper staffing levels.
Three Numbers to Track Every Week
You do not need a complicated dashboard. You need three numbers pulled every Monday morning:
1. Revenue per labour hour (RPLH): Total weekly revenue divided by total scheduled labour hours. If this number drops week over week, you are either losing sales or overscheduling. Track it by day of week to spot patterns.
2. Labour cost as percentage of revenue, by day: Not monthly. Daily. Look for any day consistently above your target by more than 3 percentage points. That day needs fewer people or more revenue-driving activity.
3. Covers per service staff per shift: For dine-in operations, this tells you whether your floor team is right-sized. In most casual dine-in formats, 15-20 covers per service staff member per shift is a reasonable range. Below 12, you have too many servers. Above 25, service quality drops.
These three metrics, tracked weekly, will give you more operational visibility than most restaurant operators have all year. Scaling without this visibility is how operators open a second location and discover their labour costs doubled while revenue only grew 40%.
What You Should Do This Week
Pull your last 8 weeks of daily revenue data from your POS. Calculate the average by day of week. Then pull your payroll records and calculate the fully loaded cost per staff member per day. Divide your daily labour cost by daily revenue for each day of the week separately.
You will find at least one day, probably two or three, where your labour cost percentage is 30% or higher while your weekend sits below 22%. That gap is your money. Not theoretical money. Real rupees sitting in your current operation that can be recovered through better scheduling alone.
Build next week’s schedule using the RPLH method. Forecast revenue by day. Set a daily labour budget. Fill essential roles first, then add staff only within budget. Do this for four weeks. Compare your labour cost percentage at month-end against the previous month.
The difference will convince you faster than any article can.
Stop guessing. Start building. Get Design Dine Dominate, the complete restaurant business playbook from someone who has actually done it.

Leave a comment