Yield Management Is the Rs 50,000 a Month Most Restaurants Never Recover
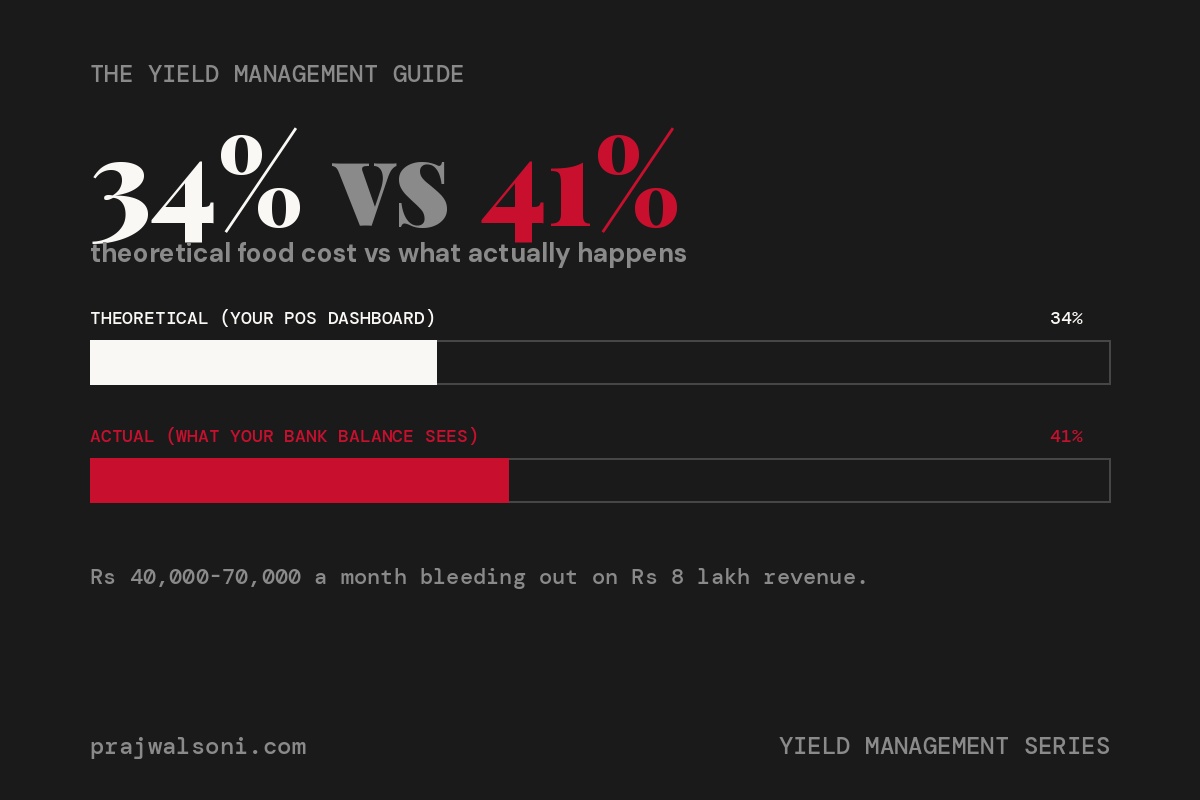
Yield management means tracking the difference between what your raw ingredients should produce and what they actually produce. In restaurants I have consulted for, this gap typically runs 3 to 7 percentage points of food cost. On a monthly revenue of Rs 8 lakh, that gap quietly bleeds Rs 40,000 to Rs 70,000 every single month. Waste tracking in restaurants is the single most underused margin protection tool in the industry.
You are running a cloud kitchen in Surat. Or a QSR in Pune. Or a biryani brand out of Hyderabad doing 200 orders a day on Swiggy and Zomato. Your Petpooja dashboard says food cost is 34%. Your CA confirms it. But your bank balance does not match. Every month, there is a gap between what the numbers say you should be making and what actually lands in your account. That gap has a name. It is called yield loss. And if you are not tracking it at the prep station level, you are guessing your way through your most controllable cost line.
What Does Waste Tracking in Restaurants Actually Look Like?
Waste tracking means recording every gram of food that does not end up on a customer’s plate. This includes trim waste from vegetables, overcooked or burnt items, expired inventory, incorrect orders, and portion overruns. Most operators in the Indian restaurant industry do none of this. They weigh ingredients at purchase, enter them into inventory, and assume everything gets used. It does not.
A 10 kg bag of onions does not give you 10 kg of usable onion. After peeling and trimming, you get roughly 8.2 to 8.5 kg depending on quality. That is a 15 to 18% trim loss on one of the cheapest ingredients in your kitchen. Now think about paneer, which can lose 8 to 12% from crumbling during cutting. Or chicken, where bone-in pieces lose 25 to 30% as bone and skin waste after cooking. If your recipe cards assume 100% yield from raw purchase weight, every dish you serve is costing you more than you think.
This is not theory. I have seen kitchens in Ahmedabad where the theoretical food cost on a dal makhani was Rs 38 per portion, but the actual cost was Rs 51 because the cook was using nearly double the butter and cream the recipe specified. No malice involved. Just no measurement system in place.
The Three Categories of Kitchen Waste You Must Track Separately
Not all waste is the same, and lumping it together makes it impossible to fix. Break your waste tracking into three buckets.
First, prep waste. This is trim loss, peeling, bones, and unusable portions. It is mostly predictable. You can account for it in your recipe costing if you use actual yield percentages instead of raw weight. A well-run kitchen in Bengaluru or Nagpur should have yield charts for every major ingredient posted at the prep station.
Second, production waste. This is food that gets cooked but never served. Burnt rotis, overcooked gravies, test batches, and items prepared for anticipated demand that did not show up. Production waste is where forecasting failures live. If your Monday dinner service consistently produces 15 portions of gulab jamun that go unsold, that is a forecasting problem, not a kitchen problem.
Third, service waste. This is food returned by customers, incorrect orders sent back, and plate waste from buffet or thali formats. Service waste is often the most expensive per unit because the full cost of cooking, plating, and labor is already sunk.
Why Do Most Restaurant Operators Ignore Yield Management?
Because it feels tedious and the losses feel small on a daily basis. Throwing away Rs 800 worth of vegetables today does not trigger alarm bells. But Rs 800 a day is Rs 24,000 a month. That is Rs 2.88 lakh a year from one category of waste in one kitchen. Scale that across multiple items and the number crosses Rs 5 lakh annually for a restaurant doing Rs 10 to 12 lakh in monthly revenue.
The other reason is that most operators confuse inventory management with waste tracking. They are not the same thing. Your POS system tells you what was sold. Your inventory count tells you what is left. But neither tells you what happened to the gap between purchase and sale. That gap is where your margin disappears. The difference between a 5% and 15% net margin often lives in exactly this blind spot.
I have also seen operators resist waste tracking because they think it signals distrust toward kitchen staff. It does not. It signals professionalism. Every serious restaurant operation, from a 50-cover dine-in in Pune to a multi-brand cloud kitchen setup, needs this discipline. Without it, you are essentially giving your kitchen team an unlimited budget with no accountability for how they spend it.
How Do You Set Up a Waste Tracking System That Actually Works?
A functional waste tracking system requires three things: a weighing scale at every prep station, a daily waste log, and a weekly review meeting. That is it. You do not need software for this. You need a Rs 1,200 digital kitchen scale and a printed sheet.
Here is the process, step by step.
1. Create yield charts for your top 15 ingredients by volume. Weigh 5 kg of raw onions. Peel and trim them. Weigh the usable portion. That ratio is your yield percentage. Do this for paneer, chicken, tomatoes, capsicum, potatoes, and every protein and vegetable you use regularly. Post these charts at the prep station.
2. Update your recipe cards to use net yield weight, not gross purchase weight. If your paneer tikka recipe calls for 100 grams of paneer per portion, and your yield from a 1 kg block is 900 grams after trimming, then your actual cost per portion is based on 111 grams of purchased paneer, not 100 grams. This one adjustment alone can shift your menu pricing math by 5 to 10%.
3. Implement a daily waste log. Print a simple sheet with columns for date, ingredient name, quantity wasted, reason for waste, and who recorded it. Place one at the prep station, one at the cooking line, and one at the pass. Every item that goes into the waste bin gets logged. Every single one.
4. Conduct a weekly waste review. Every Monday morning, before the rush, sit with your head cook for 20 minutes. Add up the week’s waste by category. Identify the top three wasted items. Ask why. Fix the root cause. If tomatoes are consistently over-ordered, adjust your purchase quantity. If dal is being made in 10 kg batches but only 7 kg sells, reduce the batch size.
5. Set a waste target as a percentage of purchases. A well-managed kitchen should keep total waste under 4 to 6% of raw material cost. If you are above 8%, you have a systemic problem in either purchasing, storage, or portioning.
How Does Yield Management Protect Cloud Kitchen Margins?
Cloud kitchens operate on thinner error margins than dine-in restaurants because aggregator commissions already take 15 to 28% of order value before you count food cost, packaging, and labor. When Swiggy and Zomato commissions consume a quarter of your revenue, every rupee lost to waste comes directly out of your net profit. There is no dine-in ambiance premium to absorb the hit.
In cloud kitchen operations, I have seen yield management reduce actual food cost by 2 to 4 percentage points within 6 weeks of implementation. On a cloud kitchen doing Rs 6 lakh a month, a 3% food cost reduction puts Rs 18,000 back into your pocket every month. That is Rs 2.16 lakh a year from a system that costs you nothing but discipline.
Cloud kitchens also benefit because they typically run a tighter menu. Fewer SKUs mean fewer ingredients to track. A biryani brand with 8 menu items has maybe 20 core ingredients. Tracking yield on 20 items is completely manageable, even without a POS integration. You just need a kitchen manager who owns the process.
What Is the Real Cost of Portion Overruns?
Portion overruns are the most common and most invisible form of waste in restaurant kitchens. They do not look like waste because the food reaches the customer. But if your recipe card says 60 grams of cheese on a pizza and your cook puts 80 grams, you just gave away 33% more cheese on every single order. At Rs 400 per kg for mozzarella, that is Rs 8 extra per pizza. Sell 80 pizzas a day and you are losing Rs 640 daily, or Rs 19,200 a month, just on cheese.
Fix this with two things. First, portion scoops and ladles measured to your exact recipe quantities. A Rs 200 portion scoop saves you thousands. Second, random spot checks. Twice a week, weigh 5 finished plates before they leave the pass. Compare against recipe specs. If portions are consistently over, retrain the line cook. If they are consistently under, you have a different problem with customer satisfaction.
This connects directly to how you manage cash flow. Your P&L might say you are profitable. But if your portions are running 10 to 15% over spec across the menu, your actual margins are lower than reported. You will feel it in your bank balance before you see it in your reports.
How Do You Use Waste Data to Make Better Purchasing Decisions?
Waste data tells you exactly where your purchasing is disconnected from your actual demand. After 4 weeks of consistent waste logging, patterns emerge that are impossible to see otherwise. You might discover that you over-purchase fresh coriander by 30% every week because your supplier only sells in 5 kg bundles and you need 3.5 kg. That 1.5 kg waste at Rs 80 per kg is Rs 120 a week, or Rs 6,240 a year, on a single herb.
The fix is obvious once you see the data. Negotiate smaller purchase quantities, find a second supplier, or adjust your menu to use the surplus ingredient in a daily special. A Surat restaurant I worked with was wasting nearly Rs 8,000 a month in expired paneer because they bought bulk on Monday and could not use it all before Thursday. Switching to two smaller deliveries per week, Monday and Thursday, eliminated the waste entirely at no extra delivery cost.
Waste data also reveals seasonal patterns. Tomato yield drops in monsoon because quality drops. If you know this from last year’s waste logs, you can adjust your purchase specs, switch to canned tomatoes for gravies during those months, or renegotiate pricing with your vendor. Operators who scale with discipline build these data loops into their operations before opening a second location, not after.
The Waste Tracking Checklist You Can Start This Week
You do not need to overhaul your kitchen to start. Begin with these five actions this week.
1. Buy three digital kitchen scales. Place one at prep, one at the cooking line, one at the pass. Total cost: under Rs 4,000.
2. Print yield charts for your top 10 ingredients. Test the yield yourself. Do not trust supplier claims or recipe books. Your onions and your kitchen produce different numbers.
3. Create a waste log sheet. Keep it physical, not digital, for the first month. Digital logs get ignored. Paper on a clipboard next to the bin gets filled in.
4. Schedule a 20-minute waste review every Monday. Look at the previous week’s log. Identify the top three wasted items. Assign one person to fix each root cause before next Monday.
5. Recalculate your top 5 sellers using actual yield percentages instead of raw weight. Compare this new food cost against your current menu price. If the margin is thinner than you assumed, you now know exactly where your dine-in profitability is leaking.
Waste tracking in restaurants is not glamorous work. Nobody posts about it on Instagram. But the operators who do it consistently are the ones who actually take home a salary at the end of the month. The ones who skip it wonder why their restaurant failed despite having great food and good reviews.
Pull your last 30 days of purchase invoices. Add up your top 10 ingredients by spend. Now compare that total against what your POS says you sold. The gap between those two numbers is your yield loss, sitting right there in plain sight. Measure it. Then fix it.
Stop guessing. Start building. Get Design Dine Dominate, the complete restaurant business playbook from someone who has actually done it.

Leave a comment